Historical analysis may sometimes be a dicey practice in the context of investments, but it can still be a useful tool for coming to defensible conclusions. Establishing confidence levels in your implementation choices is important when creating a time-segmented retirement income plan that may span 30 years or more. Rolling returns analysis is one way to glimpse into the past and shape your client’s expectations of the markets.
Let’s get rolling
So what is a rolling return? Many of us have seen “periodic” returns on account statements, such as Year-To-Date, 1 Year, 3 Year, etc. These figures focus on a single time frame with a set ending date. A “rolling” return looks at multiple time frames, with a steadily advancing ending date. The key variables in a rolling returns set are Period Length, and Interval. Period length dictates how long each roll lasts, while Interval is the time between each roll’s ending date. For example, the figure below shows a set of rolling returns with a period length of one year, and an interval of one month.
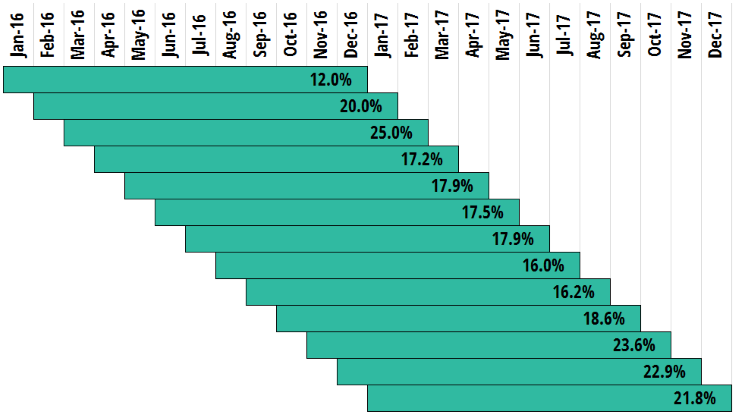
For a relatively short two year time span, we end up with 13 different investment experiences for the S&P 500 index. These years were particularly favorable, so all of the rolls show positive returns, however, there is a substantial gap between the lower return of 12.0% and the highest of 25.0%. The periods that show the most dramatic swing in returns are only separated by two months. This discrepancy highlights the risk of focusing on any one historical period as a justification for investment decisions.
The bigger the data, the better
The real power of rolling returns analysis is realized when large return data sets are put to work. Looking at one year rolling periods may not be as applicable to retirement income planning as longer periods, such as 10 or 15 year periods. When we incorporate a larger historical data set, such as one that goes back to January 1980, and change our rolling period to 10 years, we end up with 337 rolls to analyze. We can now begin to extract some more meaningful statistics:
- Minimum 10 Year Annualized Return: -3.4%
- Maximum 10 Year Annualized Return: 19.5%
- Average 10 Year Annualized Return: 10.7%
All of a sudden, there is clarity on the volatility and potential risks of an index such as the S&P 500. What if extend the period length to 20 years? We now have less rolls to analyze, but still a sizeable amount at 217.
- Minimum 20 Year Annualized Return: 6.9%
- Maximum 20 Year Annualized Return: 18.3%
- Average 20 Year Annualized Return: 10.7%
Our minimum has increased dramatically, our maximum has shrunk a bit, and our average has stayed the same. An emergent phenomenon begins to appear, namely that increased time in the market may help protect from the downside of bear market cycles.
Power in Probabilities
Retirement income planning is all about setting and meeting goals, so the next logical step is to look beyond basic metrics such as min/max/average, and focus on the probability of achieving a particular goal with your invested assets. The simplest way to define an investment goal is growth over time, which translates to a specific annualized rate of return (ROR). Let’s stick with our 20 year rolling S&P 500 data set, and look at various probabilities. It is obvious that the data showed a 0% chance of achieving less than a 6.9% annual ROR, and a 0% chance of achieving greater than an 18.3% ROR. But what about the returns in between?
| Target ROR | Probability |
|---|---|
| 7% | 99.5% |
| 8% | 83.4% |
| 9% | 59.0% |
| 10% | 48.4% |
| 11% | 43.3% |
| 12% | 34.1% |
| 13% | 20.7% |
| 14% | 14.7% |
| 15% | 12.9% |
| 16% | 5.5% |
| 17% | 3.7% |
| 18% | 0.5% |
Immediately we see that the results skew strongly towards the minimum end of the range. Nobody wants to stake their retirement investments on an asset allocation, or in this case a single equity portfolio, that shows a very low rate of success in achieving a particular return over time. We can now begin to shape our perceptions of the market, and adopt a mindset of what is a reasonable ROR to target and what is foolish.
Putting rolling returns to work
Time segmentation of retirement income plans relies on structuring assets to grow for set periods, and then distribute for set periods. Rolling returns analysis can be applied to each segment of the plan individually based on its time horizon for growth. This flexibility makes the process of determining reasonable ROR targets for each group of assets much simpler than trying to analyze one large basket of assets that needs to simultaneously grow and supply income over 25 or more years.
The information presented here represents a very simple exercise, on an index that incorporates no fees or trading costs and is on a fixed annual rebalancing schedule, so it is purely academic. However, it is possible to incorporate these metrics into rolling returns analysis, as well as diversifying the portfolio, and increasing the size of the historical data set to create a more realistic universe of investment experiences.
For more information about how IncomeConductor® incorporates rolling returns analysis into our advisor Resource Center tools, and to see a demo of the platform, Contact Us.